PothosGui: Basic signal analysis plotting widgets Tue, Aug 26 2014 AM
Introducing new display plotters
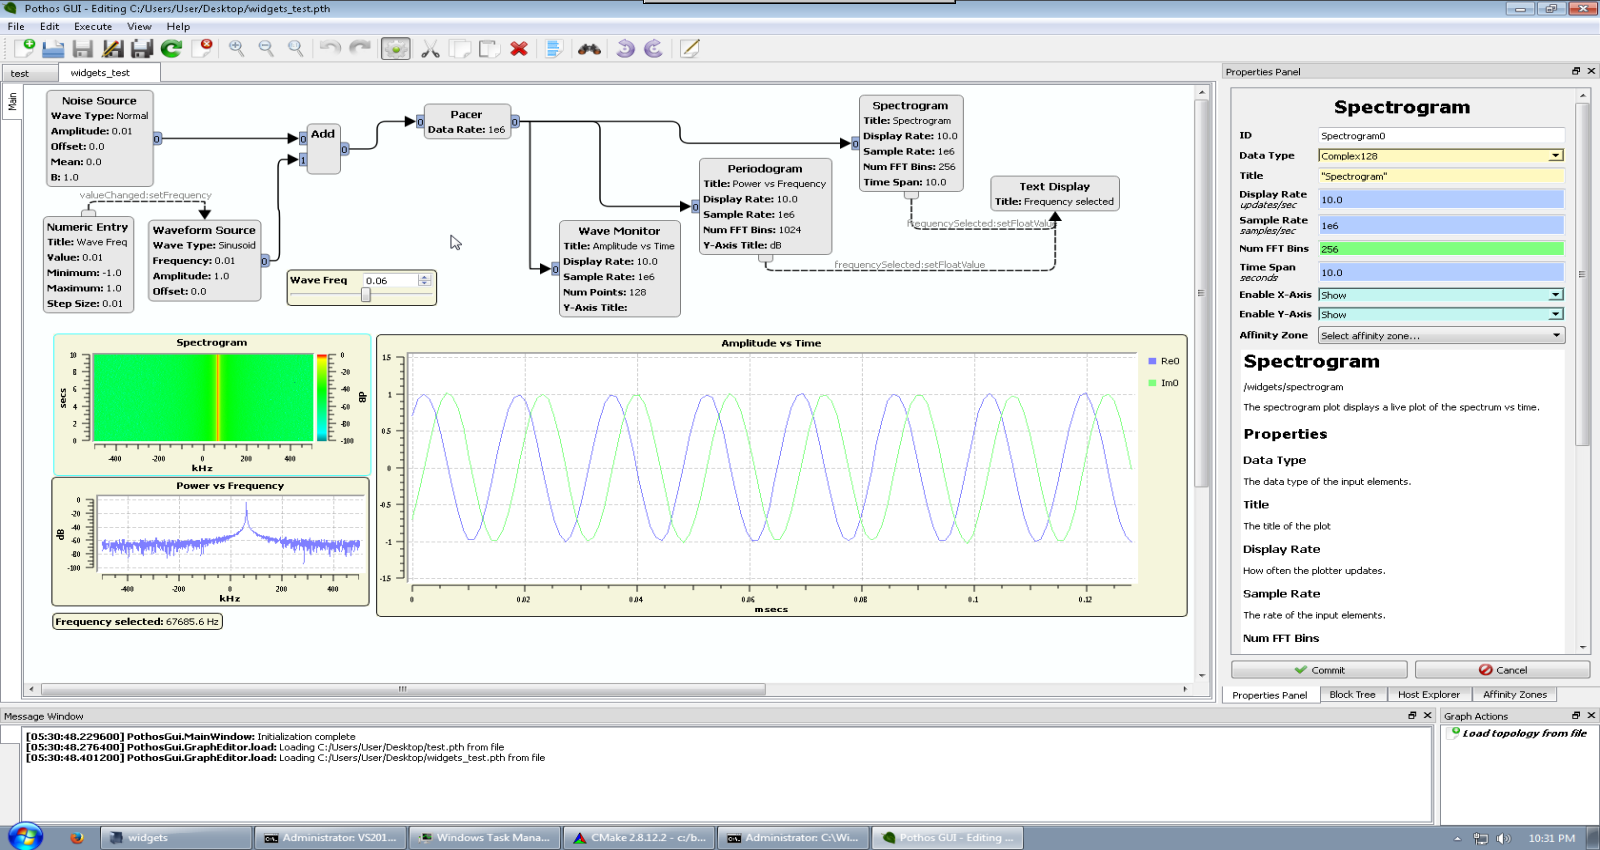
The pothos-widgets component now contains a few basic signal analysis tools:
- A waveform plotter for a time domain view of the signal
- A periodigram for frequency domain view of the signal
- A spectrogram displaying the frequency domain over time
Features
- Multi-channel support for waveform and periodigram plotter
- Fully resizable, movable -- standard graph object controls
- tranfer plots to another editor sheet for a widgets only view
- Double-click frequency selection for periodigram and spectrogram
- Live modification of plotter properties with properties panel
- Legend acts as a checkbox to disable individual plot curves
QWT plotting tools
QWT has been tremendously useful here. All of the plotters are based off of the plotter APIs provided by QWT. QWT handles the display, the scaling, the axis stuff, legends, even the spectrogram raster display.
The default QWT look and feel is a little clumsy; I was afraid the plotters would end up looking bad. However, its all just a matter of style. The fonts, sizes, colors in QWT are 100% configurable. So I tried to come up with something for that style that would be minimal and out of the way. The plot canvas is the star of the show, so the axis and main titles are all small, and there is even an option to hide all axis and titles for a really minimalistic look.
Contined work...
The plotters look good, and they are functional, but theres a few more little details to take care of:
- A mouse-based zoom selection for the plot -- this also comes with QWT
- Manual dynamic range selection for the plotters
- Triggering modes for the waveform viewer
- Trace snapshots control menu
- Trace calculations like max and average value
- FFT window modes selection menu