GNU Radio WXGUI Signal Analysis Tools
I created the OpenGL graphical sinks for signal analysis in GNU Radio. The OpenGL sinks replace the original wxgui sinks that had no hardware acceleration, and lacked severely in the UI department. The current graphical analysis tools include a spectrum analyzer, 2D spectrogram, oscilloscope, histogram, and constellation plotter.

Implementation
OpenGL + wxPython
The wxgui sinks run on top of wxPython and pyOpenGL using the GLCanvas. Each graphical sink combines a user control panel with a GLCanvas plotter and some handling. Several plotters were implemented:
- The channel plotter (scope, fft, and constellation sink)
- The waterfall plotter (waterfall sink)
- The bar plotter (histogram sink)
Performance
Even though the displays are coded in python, we avoid hampering performance in several ways:
- C++ backend blocks
- scope sink block for triggering
- histogram sink block for live histograms
- log-power fft block with averaging
- Numpy for array operations
- GL matrix transforms for scaling
- GL array lists to limit gl comm overhead
- GL compiled lists to cache static contents
- grid lines
- title, tick and axes labels
- various legends
Screenshots
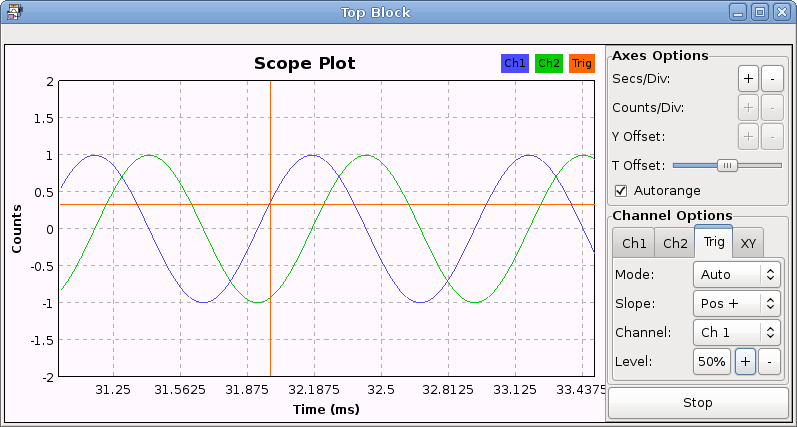
Scope Sink (oscilloscope)
- Multi-channel (up to 4 channels)
- Triggering options
- XY-Mode (chX vs chY)
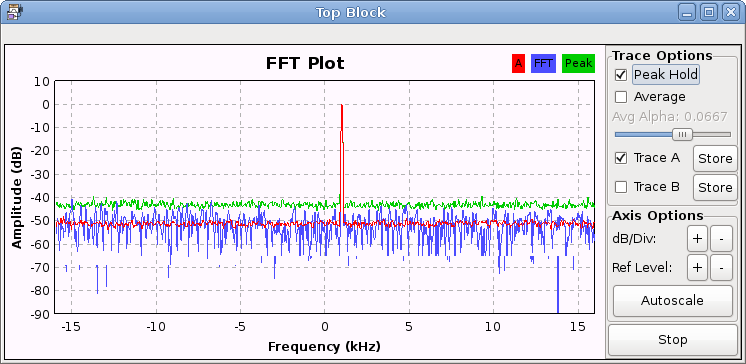
FFT Sink (spectrum analyzer)
- Real or complex
- Single channel
- Peak hold
- Bin averaging
- Trace storing (A and B)
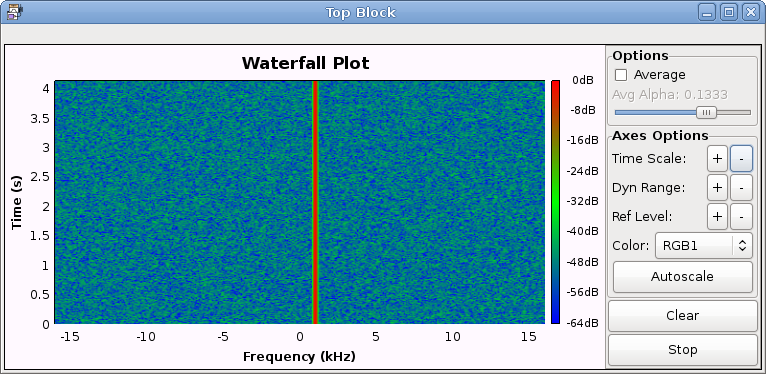
Waterfall Sink (2D spectrogram)
- Real or complex
- Single channel
- Bin averaging
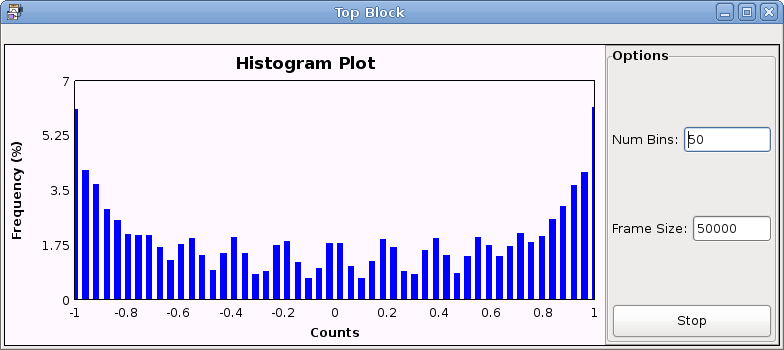
Histogram Sink
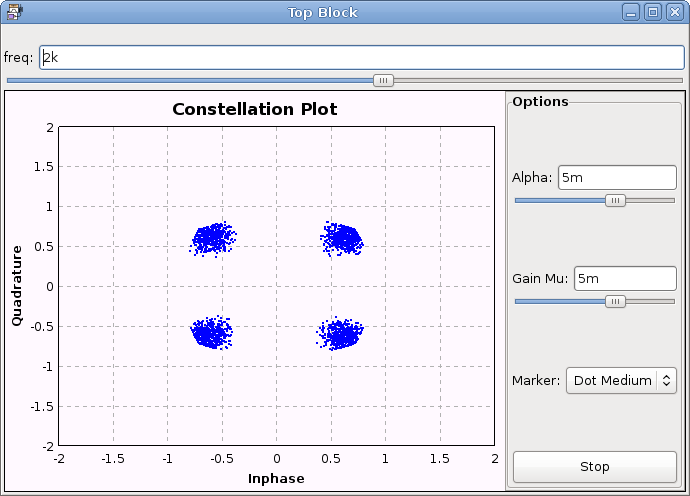
Constellation Sink
- Costas loop controls
- MPSK demodulation
Last edited:
